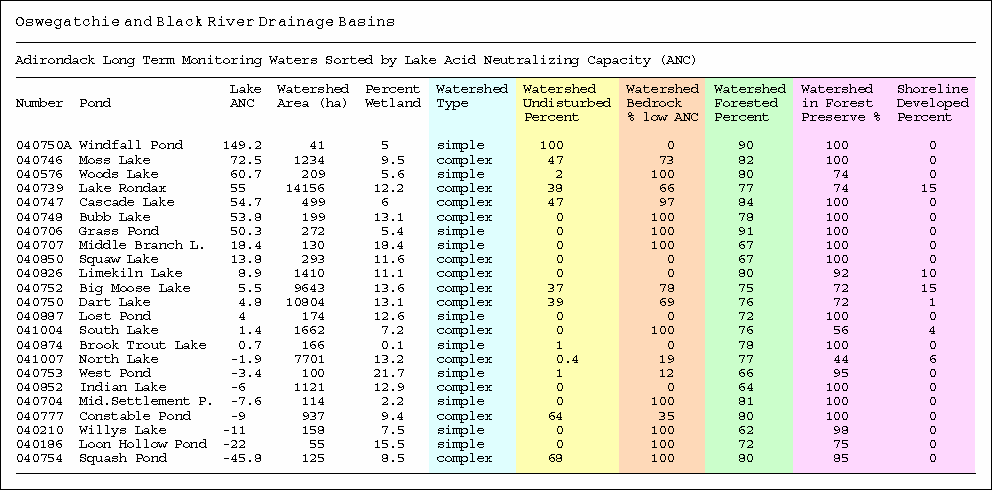
Table from the poster accompanying the final report "Influences on Wetlands and Lakes in the Adirondack Park of New York State -- A Catalog of Existing and New GIS Data Layers for the 400,000 Hectare Oswegatchie/Black River Watershed"
The map graphics on this poster are too small to identify individual lakes and examine watershed composition. To show how a GIS can integrate databases, this matrix was created to profile the Adirondack Long Term Monitoring lakes found in the study area. The columns are color coded to the database thematic groupings found on this poster.

NYS Adirondack Park Agency, SUNY Plattsburgh, Adirondack Lakes Survey Corp., 1997