Section II --
Map Development (continued) |
Local Table of
Contents:
|
From: Influences on
Wetlands and Lakes in the Adirondack Park of New York State:
A Catalog of Existing and New GIS Data Layers for the
400,000 Hectare Oswegatchie/Black River Watershed, 1997 |
One of the objectives of this study was to determine the recent history of
land use for the study area and major disturbances to the landscape. Such known and
documented disturbances include a series of major forest fires that occurred at the turn
of the last century. Other disturbances such as major storm blowdowns are discussed in
other sections of this report.
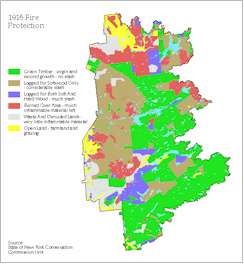 According to McMartin (1994), in the Adirondacks "before
1890, fires had been small and scattered...in the period between 1890 and 1910, however,
fires, mostly caused by railroad locomotives, plagued landowners, seriously affecting
timber tracts for the first time". Estimates of the acreage burned parkwide during
this period are over one million (McMartin 1994).
Description of existing data
Prior to this project, a digital map showing recent major fire
disturbances in the Adirondack Park did not exist. The best available paper map is one
prepared in 1916 by K.Schmitt of the State of New York Conservation Commission in Albany,
NY. It is called Fire Protection Map of the Adirondack Forest and is drawn at a
scale of 1 inch = 2 miles. There is no known documentation of how the information on this
map was collected.
Method
The polygon data were digitized directly from the map and are shown (and
labelled as):
- BURNED OVER AREA - much inflammable material left
- GREEN TIMBER - virgin and second growth - no slash
- LOGGED FOR BOTH SOFT AND HARD WOOD - much slash
- LOGGED FOR SOFTWOOD ONLY - considerable slash
- OPEN LAND - farmland and grazing
- WASTE AND DENUDED LANDS - very little inflammable material
Discussion
Historical landscape disturbances, such as fires, influence nutrient
cycling and determine plant composition. In the boreal forest ecosystem, which is an
important constituent of the Oswegatchie and Black River basins, fire is believed to be
the primary altering force in forest successional processes and many of these species
which currently exist on these sites are fire tolerant (Barbour and Billings 1988). A
forest fire can significantly affect nutrient cycling in several ways. First, the organic
matter at the surface of the forest floor is oxidized eliminating ion exchange sites that
otherwise held nutrients in the most reactive part of the soil. Also, the exposed soil
surface is reduced to ash offering a high erosion potential from uplands to lowlands.
Wetlands provide the first sink of nutrients in this net loss of nutrients from the
upland. Much of the Adirondacks was burned by devastating fires in 1903 and 1908 (Barrett et
al. 1961) and the effects of those fires, as described above, are still apparent today
(Kudish 1992).
References
- Barbour, M.G. and Billings, W.D. 1988. North American Terrestrial Vegetation. Cambridge
University Press, 434 pp.
- Barrett, J.W., Ketchledge, E.H., and Satterlund, D.R. 1961. Forestry in the Adirondacks.
State University College of Forestry, Syracuse, NY, 139 pp.
- Kudish, M. 1992 Adirondack upland flora. Chauncey Press, Saranac Lake, NY.
- McMartin, B. 1994. The great forest of the Adirondacks. North Country Books, Utica, NY.
240 pp.
One of the objectives of this study was to determine the recent history of
land use and major disturbances for the study area. 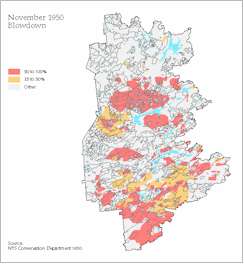 Such documented disturbances included a
major windstorm that occurred on November 25, 1950. Other disturbances are discussed in
other sections of this report.
McMartin (1994) writes about this storm:
" known as the big blowdown, it struck in November of 1950, and did
the most damage in the western and central Adirondacks. This powerful northeaster affected
420,000 acres and was said to have caused a loss that ranged from a quarter of the trees
to the entire forest cover. The loss was estimated at two million cords of softwood and
forty million board feet of hardwood. The Cold River country between Seward and Santanoni
experienced the greatest destruction, followed closely by the Moose River Plains, but
private tracts such as 60,000-acre Whitney Park, parts of the Adirondack League Club
property, or Finch Pruyn's 183,000-acre holdings were also severely damaged.
The storm was particularly devastating to old-growth forests. The wind
came from the east and northeast, while the mature trees had grown wind-firm in the
direction of more normal west winds. Because spruce had shallow roots making it prone to
wind damage and because it towered above the canopy of hardwoods, this most prized species
was stripped from most virgin stands as well as some from State land that had been logged
a half century or more earlier."
Description of the existing data
We found no existing digital map of the November 1950 storm. The best
available map was a paper blueprint prepared by the New York State Conservation Department
called the Map of Storm Damage in the Adirondack Area November 1950 drawn at a
scale of 1 inch = 4 miles. The legend on this map reads:
- 25-50% Blowdown
- 50-100% Blowdown
- County lines
- Adirondack blueline
- Stateland
This map provides the following information: "From aerial
reconnoissance data furnished by District Offices of the Conservation Department. Compiled
and drawn by Gerald J. Rides, Forest General Foreman, Conservation Department. December
1950. Map No.36".
Method
The polygon data were transferred on to a cartographically correct base
map (1:250,000 NYS DOT) and then digitized and labelled as:
- 50-100% Blowdown
- 25-50% Blowdown
- Oswegatchie/Black Boundary
References
- McMartin, B. 1994. The great forest of the Adirondacks. North Country Books. Utica, NY.
240 pp.
- New York State Conservation Department. 1950. Map of Storm Damage in the Adirondack Area
November 1950. Map No. 36. Compiled and drawn by Gerald J. Rides, Conservation Department,
December 1950.
One of the objectives of this study was to determine recent land use
history for the study area and documented natural disturbances such as major windstorms
and forest fires. In addition, we expected to discuss the potential locations of virgin
stands (never harvested).
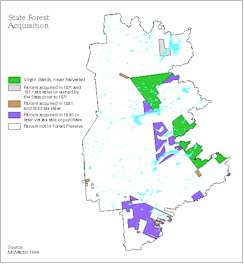 According to Barbara McMartin (1994), "In order to understand what
happened historically to different parts of the Adirondack forest, a good map is essential
for locating forest tracts, comprehending their history, and determining their
owners". This book documents the history of Adirondack logging and includes a
discussion of old growth forest occurrences.
Description of existing data
Prior to this project, only a paper map belonging to B.McMartin based on
her Adirondack logging history research was available. This map shows parcels of land
acquired over different periods by the State of New York to the Adirondack Park. McMartin
used a number of sources including a series of books on acquisition published by DEC
(1920). This acquisition information was color coded and transferred to a base map (Great
Lot Map at a scale of 1:250,000+). Much field checking was done by McMartin and others
over the years, particularly in areas where virgin stands were expected to occur.
Method
For this project the existing McMartin map was recoded and redrawn onto a
cartographically correct 1:250,000 scale map (NYS DOT) using a light table. This re-coding
included the following categories which were used as a legend:
- Virgin stands; never harvested.
- Parcels acquired in 1871 and 1877 tax sales, or owned by the State prior to 1871.
- Parcels acquired in 1881 and 1885 tax sales.
- Parcels acquired in 1890 or later via tax sale or purchase.
- Parcels not in Forest Preserve.
This final paper map product was then digitized and labelled using GIS.
References
- McMartin, B. 1994. The great forest of the Adirondacks. North Country Books, Utica, NY.
240 pp.
- New York State Department of Environmental Conservation 1920. State of New York list of
lands in the forest preserve. Appendix to 1919 annual report. J.B. Lyon Co., Albany, NY.
One of the objectives of this study was to document recent major landscape
disturbances to the study area. About half-way through this project, a major storm event
swept through northern New York across a significant portion of the study area. 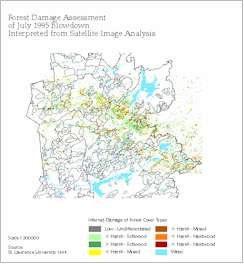 This
section of the report describes the additional study of this storm conducted in
cooperation with the NYS Department of Conservation and St. Lawrence University.
Introduction
The Oswegatchie/Black study area has been the scene of major natural
disturbances documented in the proposal and incorporated in the basic data for the
project. On July 15, 1995, a storm event impacted thousands of acres of forest,
concentrated in the Five Ponds Wilderness area, but also distributed throughout the
region, including significant areas of private forest. As we contemplated working with
both aerial photography and satellite data for analysis of ground conditions, this
presented a valuable opportunity to extend these analyses and provided a foundation for
managing the response to the catastrophe.
The Agency proposed to evaluate the spatial extent of the damage and use
of remote sensing techniques for quantitative analysis of the degree of damage in
cooperation with Dr. William Elberty, chair of the Geography Department at St. Lawrence
University. The project was amended to incorporate cooperative acquisition of Thematic
Mapper images covering this area for the period August 1994 and August 1995. Acquisition
was made possible by financial contributions from the NYS Department of Environmental
Conservation (the lead agency for disaster response), St. Lawrence University Department
of Geography, Niagara Mohawk Power Corporation and the Adirondack Park Agency.
The primary products of this effort are: 1) classified images using two
different techniques to map the storm damage, also available in digital and printed
formats; and 2) secondary analyses and documentation by Dr. Elberty as the data are used
for teaching and student projects at St. Lawrence University. The primary data sets are
owned by the Adirondack Park Agency and maintained at the Geography Department of St.
Lawrence University.
Methods
The cooperating parties evaluated the satellite scenes and acquired
geometrically corrected imagery resampled to a 25 meter standard grid cell size. The raw
satellite image was preprocessed by the EOSAT Corporation to provide an image with
standard map coordinates suitable for comparison with other similarly processed images, or
other GIS maps. While resampling simplified the analytic process, particularly for the
multi-year change analysis, the additional processing slightly degraded the data, an issue
that may be addressed in future academic analyses if copies of the raw data can also be
provided by EOSAT.
The first step in the utilization of the data was subsetting the images to
the Oswegatchie/Black study area and its vicinity for each date by St. Lawrence
University. The data were next processed using a modification of change detection
protocols as described in National Oceanic and Atmospheric Administration Technical Report
(Dobson 1995). This involved using band 7 data from each of two dates on separate color
guns in a color display. Areas with no change in data values produce a uniform green color
of varying intensity, while areas of change produce shades of red, yellow and orange
depending on the nature of change. This provided a map of storm damage that could be
scaled and visually compared with other GIS data, but as the data were unclassified, it
was not suitable for tabulation or quantitative analysis.
Dr. Elberty prepared a classified data set using the same data based on
standard remote sensing classification methods. Two LANDSAT Thematic Mapper (TM) images
captured August 8, 1994 and August 10, 1995 were analyzed to classify forest blowdown in
the area of the Five Ponds Wilderness, Adirondack State Park. The 1994 image was
classified into forest-only, agricultural/cultural, and water using a multivariate image
analysis (MIA) strategy. A forest-only mask prepared from this classification was applied
to the 1995 image and MIA (principal component analysis) performed on the forest area most
severely affected by the windstorm. The image analysis strategy uses scatter plots
generated from a principal component image that permit differentiation of non parametric
classes in "statistical space". IMAGINE 8.2 software by ERDAS Inc. was used to
generate the MIA. Seven classes were differentiated representing severity of damage
assessment as: >HARSH, <HARSH, and LOW; and the type of forest cover: Hardwood;
Mixed, and Softwood. Areas identified as "LOW" damage were not differentiated as
to cover-type affected. Class descriptions are intentionally ambiguous because of a lack
of detailed "ground truth" data. The damage categories are roughly equivalent
to: >HARSH as major damage signifying more than 60% blowdown; <HARSH as significant
damage between 30 to 60% blowdown; and LOW as occasional damage of less than 30% blowdown.
Although the classes are highly inferential, comparison of the classification with a
change detection image prepared by write function memory insertion using TM Band 7 of the
1994 and 1995 images indicates a high reliability of damage identification. Limited Global
Positioning Systems (GPS) traverses through heavy blowdown south of the hamlet of Star
Lake, N.Y. (Tamarack Creek Trail) and narrative verification from other areas suggest that
the assessment is well within the framework of its ambiguity.
Products
Both the Park Agency and the Elberty work resulted in printed and digital
maps in a raster format for use with the other GIS data sets in the Oswegatchie/Black
study. The Agency product is a graphic product that preserves the kind of detail found in
air photography and provides opportunities for rapid assessment of blowdown conditions in
comparison to other secondary maps, either in the computer or using scaled paper prints.
It has been used to verify private forest inventory maps where ground access was difficult
or impossible, to assess damage in proximity to developed areas, and for limited
assessment of damage assessments hand digitized by the Department of Environmental
Conservation from a 50-acre sample grid applied to air photography from August of 1995.
The St. Lawrence University product is a fully classified raster image
suitable for quantitative analysis of the storm damage. As additional ground truth data
has been gathered, the initial classification has proven to have good reliability, and is
a very cost effective alternative to air photo analysis. The Elberty classified raster
image is provided in digital form as a part of the digital data set for the
Oswegatchie/Black project (see graphic in report attachment).
Additional technical documentation of this data set is available with the
digital data copy.
References
- Dobson, J.E. 1995. NOAA Coastal Change Analysis Program (C-CAP): Guidance for Regional
Implementation. U.S. Department of Commerce. NOAA Technical Report NMFS 123, A Technical
Report of the Fishery Bulletin, Seattle, Washington.
One of the objectives of this study was to test the use of an interactive
tabular database, such as the Adirondack Lakes Survey Corporation water quality database,
with an ArcInfo or ArcView spatial database over a large region.
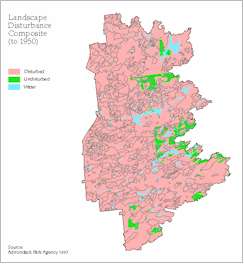
Method
Using existing GIS data layers, the pattern of major disturbance episodes
to the natural communities of the 400,000-hectare Oswegatchie/Black watershed was
depicted. The purpose of the analysis is to show, based upon the best available
information, areas of land with and without major landscape level disturbances. The
following data layers were used: State Forest Acquisition Map; 1916 Fire Protection Map of
the Adirondack Forest; and 1950 Blowdown Map.
Our first assumption is that all forest lands within the Oswegatchie/Black
study area, now or recently in private ownership, have been logged or cut over for some
purpose and therefore support only second growth forests. Only those forest lands owned by
the State of New York as Forest Preserve lands are expected to harbor old growth forest
stands.
Old growth forests of the Adirondacks are defined by Leopold et al.
(1988) as including, at a minimum, the following: an area of 8 hectares; no evidence of
human influence; an intact and undisturbed groundlayer; old-aged canopy-dominant trees
with a stand age of half the average maximum life span of the dominant tree species; a
community structure with a mosaic of canopy gaps of variable size with corresponding woody
debris and tree regeneration within the gaps. These criteria are designed to incorporate
"a long period of growth and change of the forest without human interference".
The State Forest Acquisition Map
is based upon research by Barbara McMartin (1994) documenting the year of acquisition of
parcels of land by New York State and subsequently their addition to the Forest Preserve.
Once added to the Forest Preserve, removal of the timber is prohibited by law. Some
parcels acquired by the State had never been logged and these tracts have been documented
(McMartin 1994). Further, based upon the research by McMartin, the parcels acquired by New
York State before 1890 which had been logged only for softwoods are in near pristine
condition. The logging techniques employed on these lands limited the amount and kind of
logs that were cut primarily to spruce over 10 inches in diameter, and therefore the
residual stands were left somewhat intact. Their recovery in the past hundred years leaves
them remarkably similar to stands that have never been cut. For this reason, they are
worth identifying as potentially unique natural old growth communities.
The 1916 Fire Protection Map
shows the state of the forests after several decades of logging and widespread wildfires,
most notably in the years 1903, 1908 and 1913. Stands of forests which might have been in
State ownership, and presumed to be in pristine condition prior to the forest fires, might
have been burned. Large areas of burns are shown on the Fire map.
The Blowdown Map of 1950 is a
final layer showing disturbance of the forest stands. Moderate to severe levels of
blowdown are depicted. This map does not have very fine resolution but does illustrate the
extent of this disturbance to the once forested landscape.
We note that the 1995 storm blowdown disturbance was not included in this
composite. The complete coverage for that storm was unavailable for the entire study area.
Discussion
By combining each of these layers, it can be illustrated that much of the
Oswegatchie/Black watershed has been disturbed in some way in the last century. This,
however, emphasizes the fact that the undisturbed areas are potentially highly significant
old growth forest communities. This new coverage is called the Landscape Disturbance Map
and is illustrated on the poster insert at the back of this report.
Before assuming the veracity of these data, however, the age of
canopy-dominant trees and species composition of these areas should be examined in the
field. This will help to verify what are believed, at this point, to be regional or
landscape-level patterns both of disturbed lands and of persisting old growth communities.
References
- Leopold, D.J., Reschke, C., Smith, D.S. 1988. Old-growth forests of the Adirondack Park,
New York. Natural Areas Journal 8(3):166-189.
- McMartin, B. 1994. The great forest of the Adirondacks. North Country Books. Utica, NY.
240 pp.
 According to McMartin (1994), in the Adirondacks "before
1890, fires had been small and scattered...in the period between 1890 and 1910, however,
fires, mostly caused by railroad locomotives, plagued landowners, seriously affecting
timber tracts for the first time". Estimates of the acreage burned parkwide during
this period are over one million (McMartin 1994).


