
|
Slide 1: Title slide
|

|
Slide 2: Since 1993, The Adirondack Park Agency has received several EPA Wetland Protection Program grants to map wetlands and watersheds in the Park. So far digital maps have been created for the Greater Upper Hudson, Oswegatchie/Black and the St. Lawrence River watershed. Embedded within these "super" watersheds are the subcatchments of major river systems such as the Schroon, Sacandaga, Raquette, St. Regis, Grass and Salmon Rivers as well as other large streams such as the Opalescent, Boreas, Cedar and Trout rivers. These digital wetland maps, along with other GIS data layers, are available on CD upon request.
|

|
Slide 3: The mapping used the standard Cowardin Classification system with some shorthand and water regime modifications to expedite the task and reflect the unique hydrologic conditions and 30 years of wetland mapping experience in the Park.
|

|
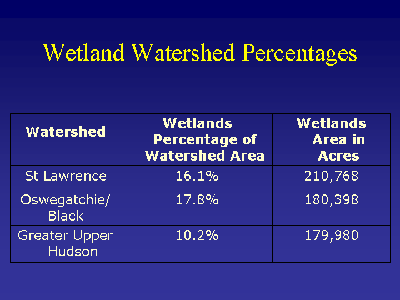
Slide 4: Mapping was completed for the "super" watersheds and as we began to look at the maps several interesting things became evident. First, the relative amount of wetlands in each watershed varied. For instance, The St. Lawrence watershed averaged 16.1% of its surface area as wetland.
|
|
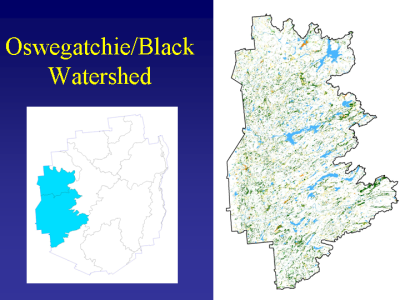
Slide 5: The Oswegatchie/Black averaged 17.8% of its surface area as wetland.
|
|
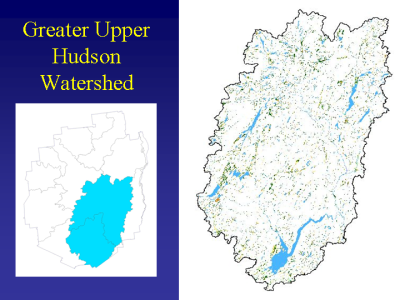
Slide 6: And Greater Upper Hudson averaged 10.2% wetland area.
|
|
Slide 7: Statistical sampling in the remaining Lake Champlain and Mohawk watersheds indicate 5.1% and 10% wetland coverage respectively. Some individual quads we have mapped in the Park exhibited over 20% of their surface area covered by wetlands.
|
|
Slide 8: A second interesting thing that became evident in our wetlands mapping was that large wetland complexes began to stand out. In the past, we often focused on three large wetland systems: Spring Pond Bog, Massawepie Mire and Bloomingdale Bog. These are all large peatlands mostly under State ownership, easement or held by an environmental group dedicated to their preservation. But we began to find more and more large wetlands of significance.
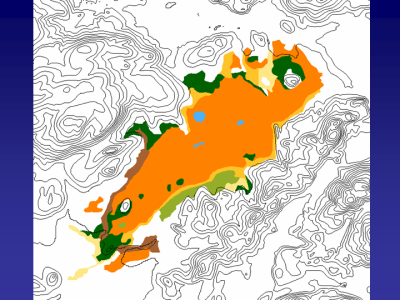
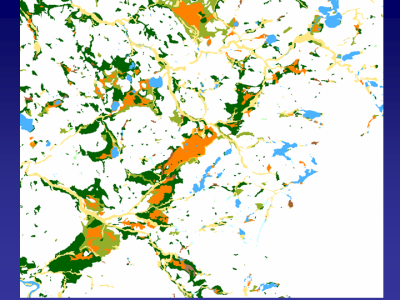
A third important result of our wetlands mapping was that what we had identified in the past as discrete wetland boundaries became less discrete. For instance, whenever anyone looked at or mapped Spring Pond Bog, the large open peat mat with embedded ponds and "patterning" was the focus. This slide shows the typical extent of Spring Pond Bog that most of us have identified over the years.
|
|
Slide 9: When you zoom out a bit, you begin to see the totality of the wetland system that makes up Spring Pond Bog. The reality is that SPB is part of a much larger wetland system. This new or mega-Spring Pond Bog runs for approximately 54,000 feet or 10 miles with a 70 foot change in elevation and has a slope of 0.13 percent. This may be the longest, flattest area in the Park outside of large lakes.
|
|
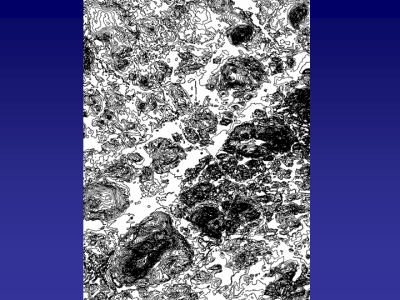
Slide 10: If you just display topo in black and white it becomes very evident where large flat areas are. Typically this would be the first place to look for charismatic megawetlands.
|
|
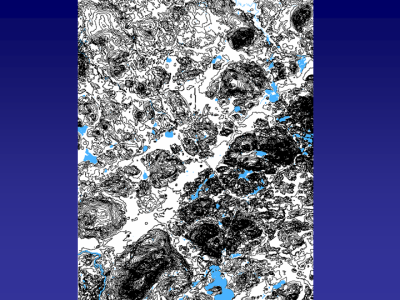
Slide 11: By adding lakes and ponds and perhaps hydrography you can get an even better idea of the hydrologic connectivity of the landscape.
|